
Introduction
In the age of information explosion, each of us has accumulated a vast amount of knowledge and information. However, this knowledge often exists in scattered, isolated forms, making it difficult to form an organic whole. The emergence of knowledge graph visualization technology provides us with a new way to organize, understand, and utilize this knowledge.
This article will introduce you to the basic concepts, practical methods, and tools of knowledge graph visualization, helping you transform abstract knowledge connections into intuitive visual graphs, thereby more effectively managing and utilizing your knowledge assets.
What is Knowledge Graph Visualization?
Core Concepts
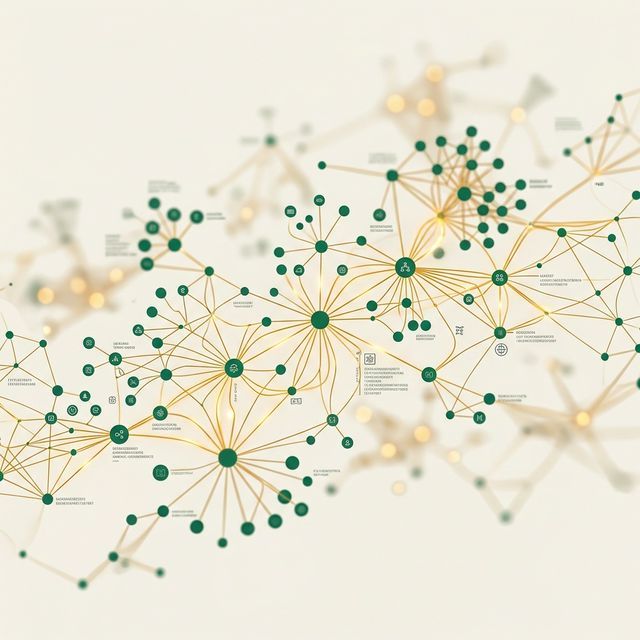
Knowledge graph visualization is a technology that displays relationships between knowledge through graphical means. It constructs a visual network through nodes (representing concepts, entities) and edges (representing relationships), helping us intuitively understand the connections between knowledge.
Value of Knowledge Graphs
- Discover Hidden Connections: Discover potential connections between knowledge through visualization
- Improve Memory Efficiency: Images are easier to remember than text
- Enhance Understanding Depth: Understand knowledge systems through a holistic perspective
- Promote Creative Generation: Cross points between different fields of knowledge are often sources of creativity
- Optimize Knowledge Management: More clearly organize and manage knowledge assets
Basic Elements of Knowledge Graph Visualization
1. Nodes
- Types: Concepts, entities, topics, etc.
- Attributes: Size, color, shape, etc.
- Hierarchy: Central nodes, secondary nodes, edge nodes
2. Edges
- Types: Association, causality, hierarchy, etc.
- Attributes: Thickness, color, style, etc.
- Direction: Unidirectional, bidirectional
3. Layout
- Force-Directed Layout: Layout algorithm based on physical simulation
- Hierarchical Layout: Tree-structured hierarchical display
- Circular Layout: Circular arrangement around central nodes
- Geographic Layout: Layout based on geographical location
Practical Steps for Knowledge Graph Visualization
Phase 1: Data Preparation (1-2 weeks)
- Define Scope: Clarify the theme and boundaries of the knowledge graph
- Collect Data: Organize relevant concepts, entities, and relationships
- Structure Data: Organize data into nodes and edges
- Define Attributes: Add appropriate attributes to nodes and edges
Phase 2: Graph Construction (2-3 weeks)
- Select Tools: Choose appropriate visualization tools based on requirements
- Import Data: Import structured data into the tool
- Adjust Layout: Select suitable layout algorithms
- Optimize Visual Effects: Adjust the style of nodes and edges
Phase 3: Analysis and Application (Ongoing)
- Explore Graph: Discover connections between knowledge
- Analyze Patterns: Identify patterns and structures in the knowledge network
- Generate Insights: Produce new understanding based on graph analysis
- Apply to Practice: Apply insights to real-world problems
Recommended Knowledge Graph Visualization Tools
1. Obsidian
Features:
- Native support for bidirectional links and knowledge graphs
- Local storage, data security
- Rich plugin ecosystem
- Markdown format support
Applicable Scenarios: Personal knowledge management, academic research, creative writing
2. Neo4j Bloom
Features:
- Professional graph database visualization tool
- Powerful query and analysis capabilities
- Support for large-scale knowledge graphs
- Enterprise-level solution
Applicable Scenarios: Enterprise knowledge management, complex data analysis, relationship network analysis
3. Gephi
Features:
- Open-source network analysis and visualization tool
- Rich layout algorithms
- Support for large-scale networks
- Powerful analysis capabilities
Applicable Scenarios: Academic research, network analysis, complex relationship visualization
4. Cytoscape
Features:
- Visualization tool focused on biological networks
- Highly customizable
- Plugin extension support
- Suitable for complex network analysis
Applicable Scenarios: Bioinformatics, complex network analysis, scientific research
5. Graphviz
Features:
- Command-line tool, generates graphs through code
- Highly customizable
- Suitable for automated generation
- Lightweight solution
Applicable Scenarios: Software development documentation, system architecture design, automatically generated graphs
Best Practices for Knowledge Graph Visualization
1. Keep it Simple
- Node Count: Control within 50-100 nodes to avoid information overload
- Relationship Types: Limit the number of relationship types to keep the graph clear
- Visual Elements: Use consistent color and shape coding
2. Highlight Key Points
- Central Nodes: Use core concepts as central nodes
- Hierarchical Structure: Express knowledge hierarchy through layout and visual elements
- Key Paths: Highlight important knowledge connections
3. Interactive Design
- Zoom Functionality: Support zooming in to see details, zooming out to see the whole
- Filter Functionality: Allow users to filter nodes based on tags or attributes
- Search Functionality: Quickly locate specific nodes
- Details Panel: Display detailed information when clicking nodes
4. Continuous Updates
- Regular Maintenance: Keep the graph up-to-date and accurate
- Version Control: Track the evolution process of the graph
- Feedback Mechanism: Optimize the graph based on usage feedback
Application Scenarios for Knowledge Graph Visualization
1. Personal Knowledge Management
- Learning Notes: Transform learning content into knowledge graphs
- Project Management: Visualize project components and relationships
- Creative Generation: Stimulate new ideas through knowledge connections
- Career Development: Plan personal skill development paths
2. Academic Research
- Literature Review: Visualize citation relationships between literatures
- Research Fields: Map knowledge structures in subject areas
- Collaboration Networks: Analyze collaboration relationships between researchers
- Concept Evolution: Track the development and evolution of concepts
3. Business Applications
- Market Analysis: Visualize market trends and competitive relationships
- Customer Analysis: Understand customer behavior and preferences
- Product Design: Map product features and user needs
- Supply Chain Management: Optimize supply chain networks
4. Education Field
- Curriculum Design: Visualize course content and learning paths
- Knowledge Assessment: Evaluate students’ knowledge mastery
- Teaching Resources: Organize and manage teaching resources
- Learning Analysis: Analyze learning patterns and effects
Case Study: Building a Personal Knowledge Management Graph
Step 1: Data Collection
- Organize existing notes and knowledge
- Extract core concepts and entities
- Identify relationships between concepts
- Add attributes to nodes and edges
Step 2: Graph Construction
- Use Obsidian to create notes and bidirectional links
- Use Obsidian’s graph view to see knowledge connections
- Adjust graph layout and visual effects
- Add tags and categories
Step 3: Analysis and Application
- Discover hidden connections between knowledge
- Identify blank areas in the knowledge network
- Plan learning paths based on the graph
- Use the graph to generate new content and insights
Future Development of Knowledge Graph Visualization
1. Artificial Intelligence Integration
- Automatic Graph Generation: Use AI to automatically extract knowledge from text and build graphs
- Intelligent Recommendations: Recommend related content based on knowledge graphs
- Predictive Analysis: Predict knowledge development trends through graph analysis
2. Multi-modal Fusion
- Text and Images: Integrate image content into knowledge graphs
- Audio and Video: Process and analyze multimedia content
- Sensor Data: Integrate IoT data into knowledge graphs
3. Real-time Collaboration
- Multi-person Editing: Support team collaboration in building knowledge graphs
- Version Control: Track the change history of graphs
- Permission Management: Control access permissions for different users
4. Immersive Experience
- Virtual Reality: Interactively explore knowledge graphs in VR environments
- Augmented Reality: Overlay knowledge graphs onto real environments
- 3D Visualization: Use 3D technology to display complex knowledge networks
Common Challenges and Solutions
Challenge 1: Data Quality
Problem: The quality of knowledge graphs depends on the quality of input data
Solutions:
- Establish standard processes for data collection and verification
- Use tools to automatically check and clean data
- Regularly review and update data
Challenge 2: Graph Complexity
Problem: As knowledge grows, graphs may become too complex
Solutions:
- Adopt hierarchical design, from macro to micro
- Use filtering and search functions to manage complexity
- Regularly organize and optimize graph structure
Challenge 3: Tool Selection
Problem: There are multiple knowledge graph tools on the market, making selection difficult
Solutions:
- Choose tools based on specific needs and usage scenarios
- Start small and gradually expand
- Consider tool scalability and ecosystem
Challenge 4: Continuous Maintenance
Problem: Knowledge graphs require continuous maintenance and updates
Solutions:
- Establish regular maintenance habits
- Use version control to track changes
- Encourage team members to jointly maintain
Conclusion
Knowledge graph visualization is a powerful tool that not only helps us better organize and manage knowledge but also helps us discover hidden connections between knowledge, inspiring new ideas and insights. With the continuous development of technology, the application scenarios of knowledge graph visualization will become more and more extensive, becoming an important means for us to understand and utilize knowledge.
Whether you are a student, researcher, entrepreneur, or ordinary knowledge worker, knowledge graph visualization can provide you with new perspectives and tools, helping you maintain clear thinking and efficient learning ability in the age of information explosion.
Start building your knowledge graph today, make your knowledge network visible, and take your learning and work to the next level.
Related Reading: Building a Personal Knowledge Graph: Breaking the Linear Shackles of Folders — Learn how to build knowledge networks through bidirectional links
Related Reading: How to Build a Personal Knowledge Management System — A complete guide to systematically building a second brain
Scan to Follow
Platform